
Understanding the dynamic world of financial markets can be complex, particularly when considering the varied strategies and tools available for traders. Kagi charts, a technical analysis tool utilized to assess price movements and predict future trends, have emerged as a favorite among many traders. As part of understanding the intricacies of investments, learning to use a Kagi chart can be an edge. This article will uncover the mystery, application, and strategies of Kagi charting. Keep reading to learn more.
Understanding the Kagi Chart
A Kagi chart is a type of chart used in technical analysis. Unlike time-based charts such as the line, bar, or candlestick, the Kagi chart is independent of time and only changes direction when a pre-set reversal amount is met. Originating from Japan, it offers unique insights into market trends and momentum. It’s important in helping traders to filter out the market’s noise and focus on substantial price moves.
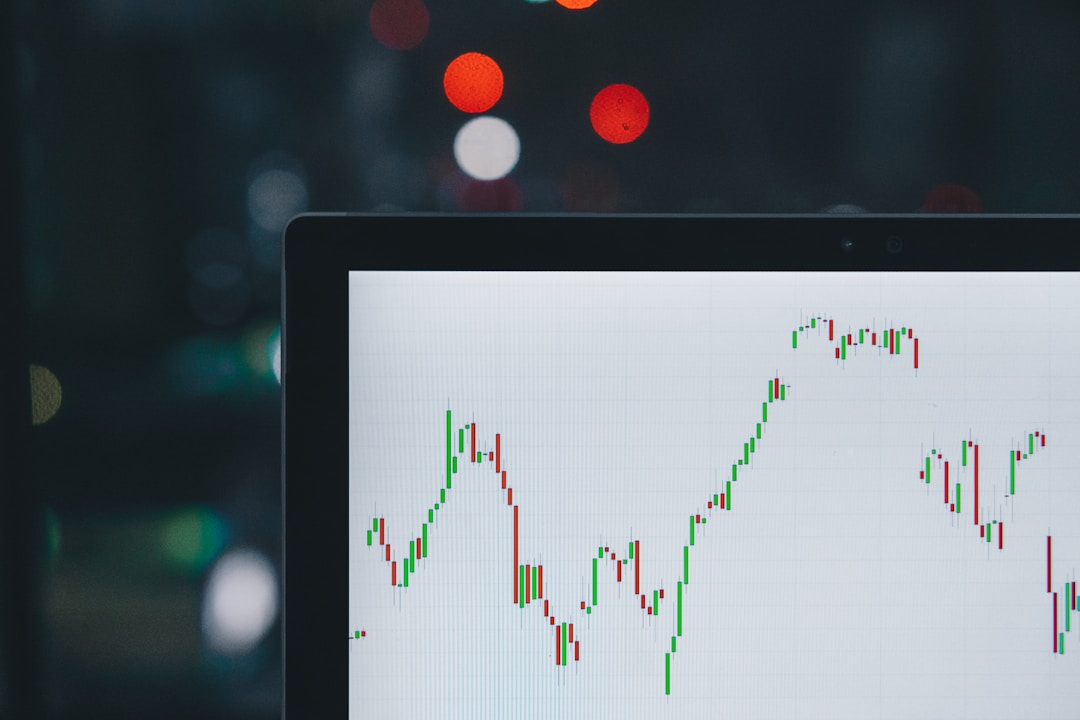
A Kagi chart consists of a series of vertical lines depicting an asset’s price action. These lines can change direction based on the asset’s price movement. The thickness and color of the lines vary depending on the direction of the trend and the nature of price movement. Essentially, Kagi charting is an effective tool to picture the force of price by accounting for time-independent movements.
One key advantage of Kagi charts is their simplicity. In the crowded world of trading, it can be easy to get overwhelmed by information. The straightforward design of Kagi charts allows traders to concentrate on the most significant information: the price. This unique feature contributes significantly to their popularity among traders of all experience levels.
How To Use Kagi Charts
Like most trading tools, the effectiveness of Kagi charts depends on how they are used. This charting method was originally designed to track the price movements of rice, one of Japan’s primary agricultural commodities. However, it has proven useful in various financial markets, from stocks and bonds to forex and cryptocurrencies.
Firstly, Kagi charts can provide clear insight into the balance of supply and demand for a given asset. When the lines on a Kagi chart are in an upward trend, this indicates bullish sentiment in the market, suggesting an opportunity to buy. Conversely, a downward trend implies bearish sentiment, signaling an opportunity to sell.
Secondly, these charts can also help traders determine support and resistance levels. By identifying these levels, traders can make more informed decisions regarding entry and exit points for their trades. This tool can also be useful in identifying breakout points that could signal the start of a new trend.
Combining Kagi Charts With Other Analysis Tools
Like all trading tools, Kagi charts should not be used in isolation. A more comprehensive insight into the market can be achieved by combining a kagi chart with other types of analysis. For example, combining Kagi charts with candlestick analysis can provide a more comprehensive picture of market sentiment. Similarly, incorporating fundamental analysis can add contextual understanding about why certain price movements may be happening.
Implementing Kagi charts in the trading arsenal can provide significant benefits. Successfully trading with Kagi charts requires understanding what they represent, interpreting them effectively, and incorporating them into a broader strategy that combines other forms of analysis. Though it might take some effort initially to get used to this unique form of charting, the potential insights and benefits they can bring to your trading efforts make it worthwhile.
Article by Born Realist